The best time to cold call business owners: our own data
Bassel, Founder of TalaLevel ·
On our floor the hour mattered much less than the usual advice says. A person answered about 7% of our calls in every hour from 9am to 5pm, in their own time. Friday was our best day at 10.4% and Saturday the worst at 4.4%. Our first count said 5pm and Saturday were far ahead, but that count was treating voicemails and call screeners as conversations.
Everybody has a rule for this. Call Tuesday at 10. Never call on a Monday. Never call at lunch. We wanted to know which of them hold up for the people we call, so we counted our own calls.
We run a small outbound floor that calls business owners across the US. In the past three months we made over 20,000 calls. The percentages in this post come from the ones our own system recorded and transcribed, from September to early November 2026, some made by our reps and some by our AI caller. Every hour below is the hour on the owner’s clock, not ours.
We ended up counting twice. The first count gave us a clear best hour and a clear best day. The second one took both away, and it’s the one we trust. Both are below, because the gap between them is the most useful thing we learned.
The short answer
For us the hour barely mattered. Between 9am and 5pm a person answered about 7 calls in every 100, whichever hour we called in. Friday was the best day and Saturday was the worst.
What mattered a lot more was how we counted. If you take one thing from this post, it’s that a call lasting 30 seconds doesn’t mean you talked to anyone.
The first count: 5pm and Saturday
The first time round we did what most teams do. We said a call that lasted 30 seconds or more was a conversation, and anything shorter was a voicemail greeting, a screener or a hang-up. Then we worked out the share of calls in each hour that passed that bar.
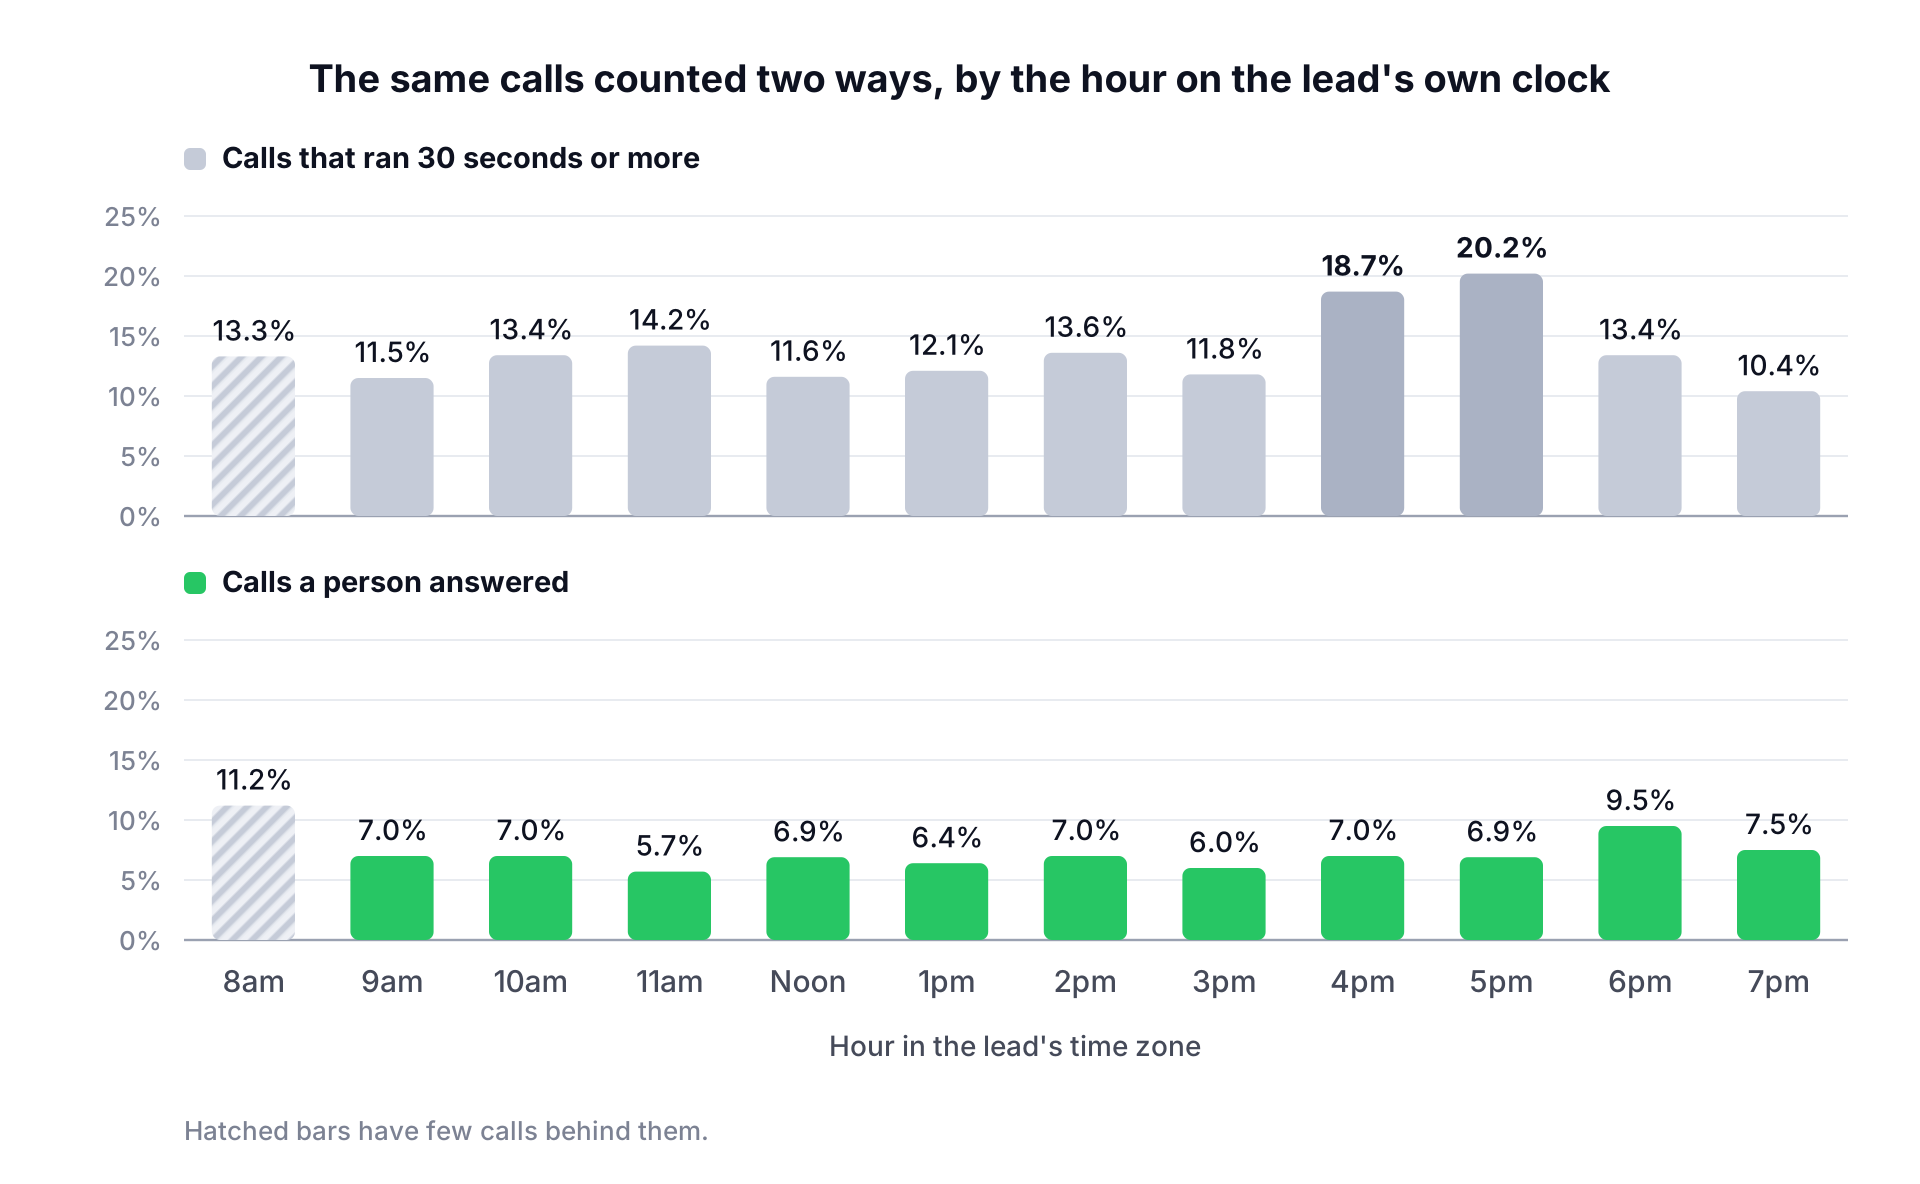
On that count 5pm was where we saw the big jump. 20.2% of the calls we placed in that hour ran past 30 seconds, against 11% to 14% for most of the day, and 4pm was close behind at 18.7%. Saturday looked even better, at almost 29%.
We had a story ready for it, too. An owner at 5pm has stopped working and hasn’t gone home yet. On a Saturday they’re in the shop with nobody else calling. It sounded right. Then we looked at what was actually on those calls.
What was on the other end of those calls
Every call we make is transcribed, and each transcript is read and marked with what answered: a person, a voicemail, a call screener, a phone menu or nothing. So we took the calls that ran 30 seconds or more and looked at what was on them.
About a third had a person on the line. More than four in ten were call screeners, and about one in seven were voicemail.
A call screener is the phone feature that picks up for the owner and says something like “record your name and reason for calling, and I’ll see if this person is available.” You say who you are, it asks you to stay on the line, and most of the time nobody comes. That whole exchange takes 40 to 50 seconds. On a 30-second rule it counts as a conversation.
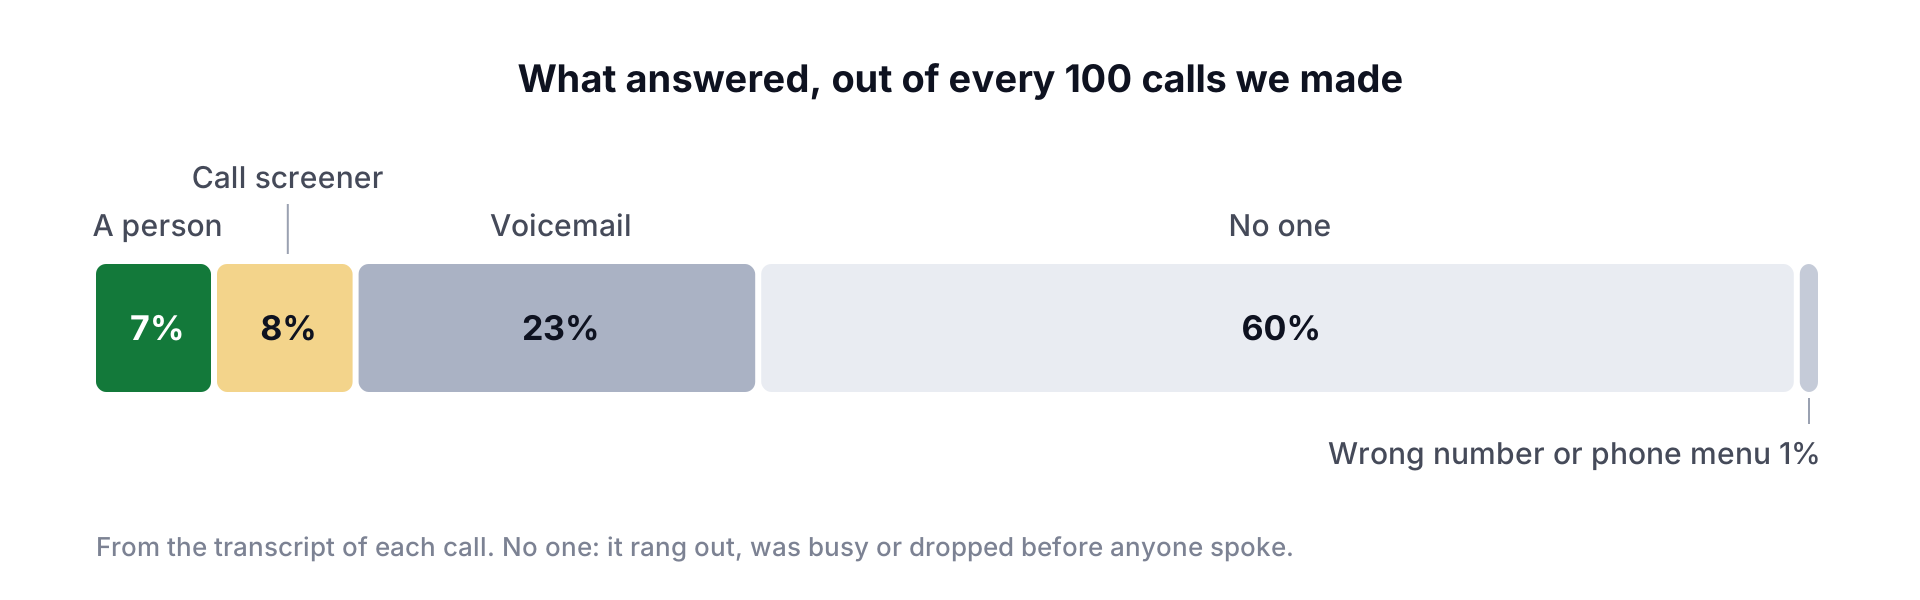
Across all our calls a person answered 7.0% of the time. A call screener answered 8.2%, so we were screened more often than we were answered. Voicemail took 23.3%, and on about 60% nothing picked up at all. For the same calls, the dialer’s own “answered” figure was 68%.
Saturday turned out to be one day. One Saturday in October our AI caller worked through a long list. A lot of those calls went to voicemail, it left a message, and the messages ran past 30 seconds. On the first count that one day came out at 33%. A person actually answered 4.4% of our Saturday calls, which makes it the worst day of the week.
Hour by hour, counting people
This is the same set of calls counted both ways.
| Their local hour | Ran 30 seconds or more | A person answered |
|---|---|---|
| 8am | 13.3% | 11.2% |
| 9am | 11.5% | 7.0% |
| 10am | 13.4% | 7.0% |
| 11am | 14.2% | 5.7% |
| Noon | 11.6% | 6.9% |
| 1pm | 12.1% | 6.4% |
| 2pm | 13.6% | 7.0% |
| 3pm | 11.8% | 6.0% |
| 4pm | 18.7% | 7.0% |
| 5pm | 20.2% | 6.9% |
| 6pm | 13.4% | 9.5% |
| 7pm | 10.4% | 7.5% |
A few things we read off the right-hand column.
From 9am to 5pm it’s flat. Every hour is between 5.7% and 7.0%. Lunch isn’t worse. Noon was 6.9%, right on the average.
5pm is an ordinary hour. 6.9%. We don’t know why so many more of our 5pm calls ran long without a person on them, and we’re not going to guess a second time.
The edges of the day look a bit better. 6pm was 9.5%. 8am was 11.2%, but we made few calls that early, so we don’t lean on it.
Day by day
| Day | A person answered |
|---|---|
| Monday | 6.7% |
| Tuesday | 7.8% |
| Wednesday | 6.6% |
| Thursday | 6.4% |
| Friday | 10.4% |
| Saturday | 4.4% |
| Sunday | 6.4% |
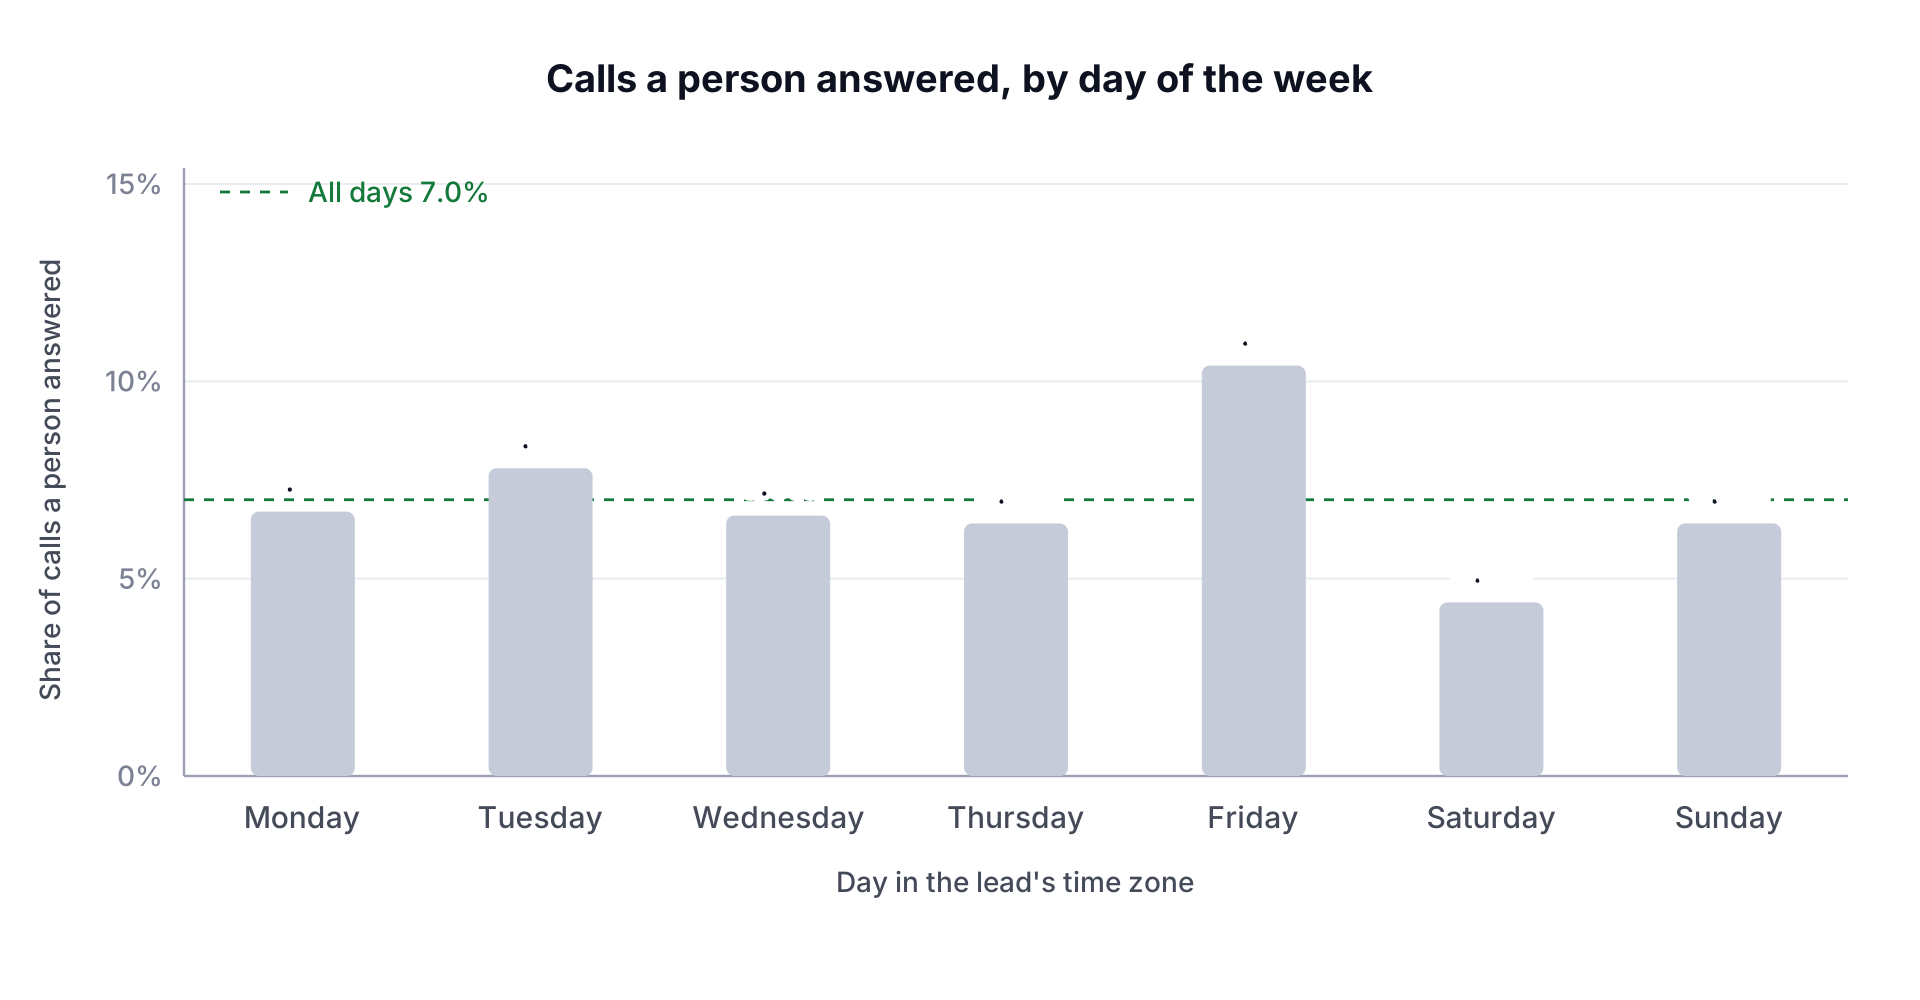
Monday is fine. The “never call on a Monday” rule didn’t show up in our calls at all, and Monday to Thursday are within a point and a half of each other.
Friday is where we saw the most people pick up, at 10.4%. One thing to know about that row: all of our Friday calls were made by our reps, and our reps’ calls reach a person more often than our AI caller’s do. Against the reps’ other weekdays, which run from 6.8% to 8.7%, Friday is still ahead, just by less than the chart suggests.
Saturday and Sunday were our weakest days, and we wouldn’t call owners on a Sunday anyway.
Our reps’ calls on their own
Our reps and our AI caller work different lists, so we split them.
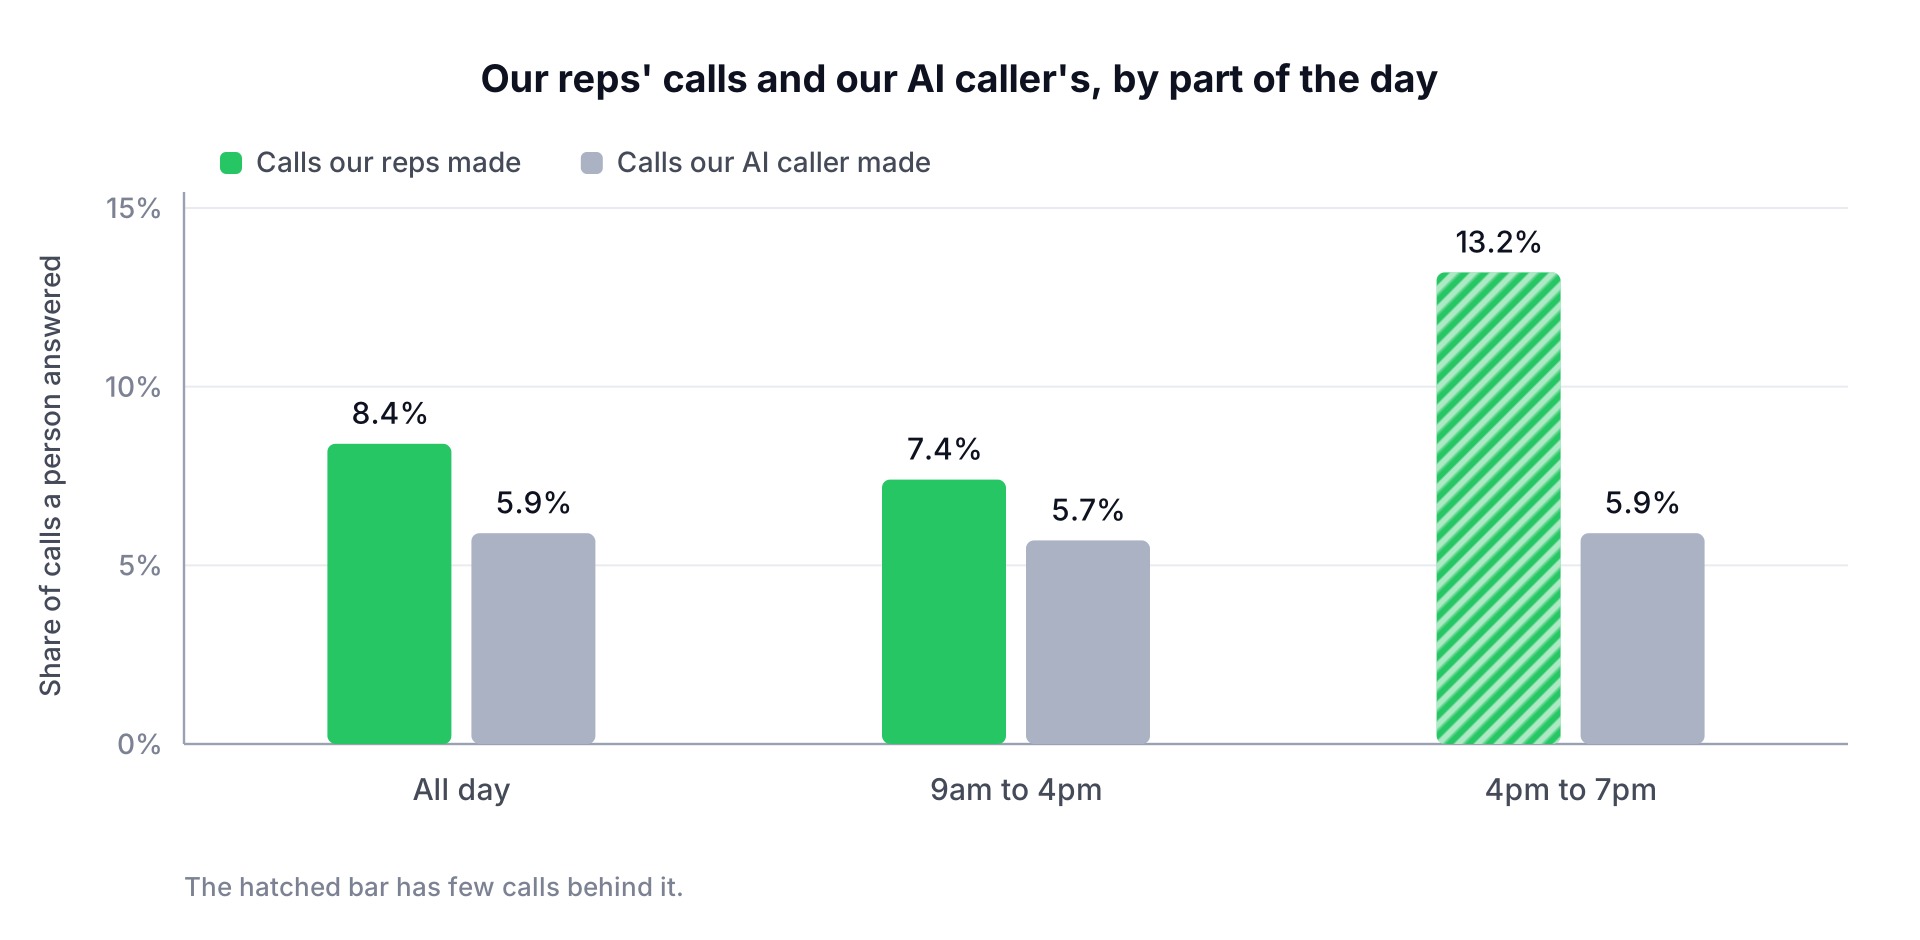
For the AI caller the time of day did nothing. A person answered 5.7% of its calls between 9am and 4pm and 5.9% between 4pm and 7pm.
For our reps there was a difference. A person answered 7.4% of their calls between 9am and 4pm and 13.2% of the ones they made between 4pm and 7pm. That’s nearly double, and it’s the one place in all of this where late in the day looks better.
We’re careful with it for two reasons. Our reps made far fewer calls after 4pm than in the middle of the day. And a rep’s late calls aren’t a random slice of the list. Some of them may be people who asked to be called later in the day. So part of that 13.2% could be the lead and not the hour. It’s worth testing, and we wouldn’t plan a week around it yet.
What we’d do with this
- Call through the whole day. We’d stop saving the good list for a certain hour, because for us there wasn’t one between 9am and 5pm.
- Don’t skip lunch or Mondays because someone told you to. Neither was worse for us.
- If you have reps, try moving one block of calling to after 4pm in the lead’s time zone for two weeks, then count how many people answered. That’s the test we’d run on the 13.2%.
- Have an answer ready for call screeners. They picked up more of our calls than people did, and the call only goes through if you say who you are.
- Change what you count before you change when you call. The hour moved our number by a point or two. The way we counted moved it by half.
How to count your own calls
Our leads are small business owners. Yours might be dentists or IT directors, and their day looks different. You can run the same count in an afternoon.
- Export your calls with when each one started, how long it ran, and the lead’s state or time zone.
- Convert every start time to the lead’s local hour. A call you made at 2pm Eastern to someone in California happened at 11am for them.
- Don’t use the dialer’s “answered” figure, and don’t use call length on its own. Ours said 68% answered and 13.6% over 30 seconds when a person had picked up 7.0% of the time.
- If your calls are transcribed, mark each one by what answered: a person, a voicemail, a screener, a menu or nothing. If they aren’t, take 50 calls from each hour, listen to the first ten seconds of each and write down what picked up.
- Count calls and people per hour and divide.
- Don’t trust an hour with only a few hundred calls in it. Our 8am row is like that.
- Before you believe a result, split it by who made the calls and which list they were on. Our Saturday number was one list on one day.
Where these numbers are weak
This is one floor and one kind of lead, over about ten weeks of transcribed calls. What answered each call was marked from its transcript by software, and it will have got some of them wrong, though the sample we read by hand matched. We didn’t pick at random who got called when, so some of the gaps between hours and days could be the lists.
The flat middle of the day has the most calls behind it, and it’s the part we’d bet on. The Friday number and our reps’ late-afternoon number have fewer calls behind them.
If you want to know how many times to call a lead who doesn’t pick up, we counted that as well, and it moved our numbers far more than the hour did: how many times to call a lead before giving up. The dialer we built answers call screeners in the rep’s own recorded voice and knows what time it is where each lead is. That’s on the power dialer page.
Questions
- What is the best time of day to cold call business owners?
- On our floor no hour between 9am and 5pm stood out. A person answered between 5.7% and 7.0% of calls in each of those hours, in the owner’s own time zone. 6pm was a little higher at 9.5%, and 8am looked better still, on few calls.
- What is the best day of the week to cold call?
- Friday was our best day, with a person answering 10.4% of calls. Monday to Thursday were between 6.4% and 7.8%. Saturday was the worst at 4.4%.
- Is 5pm a good time to cold call?
- It looked like our best hour when we counted every call of 30 seconds or more, at 20.2%. When we counted only the calls a person answered, 5pm was 6.9%, the same as the rest of the day. The difference was voicemails and call screeners.
- How often does a cold call reach a person?
- About 7 calls in 100 on our floor. Our reps’ own calls reached a person 8.4% of the time and our AI caller’s 5.9%. The dialer’s own answered figure for our calls was 68%.
- How should you count a conversation on a cold call?
- By who answered, not by how long the call ran. About a third of our calls that ran 30 seconds or more had a person on them. The rest were mostly call screeners and voicemail greetings.
Keep reading
The sales CRM that calls, texts and follows up.From $47 a seat a month · Cancel anytime